
Ichimoku cloud is a popular trading system indicator that will give the best buy and sell signal for any market, whether it is stock, currency, or option. Japanese journalist Goichi Hosoda developed the Ichimoku cloud and published it for the public in 1960.
At first glance of looking it doesn’t seem very easy at first glance, but when you understand how to use it, it’a easier to use and a more highly profitable trading system.
Core Ichimoco trading system lines and the parameters
You must first understand five significant lines and know what it says.
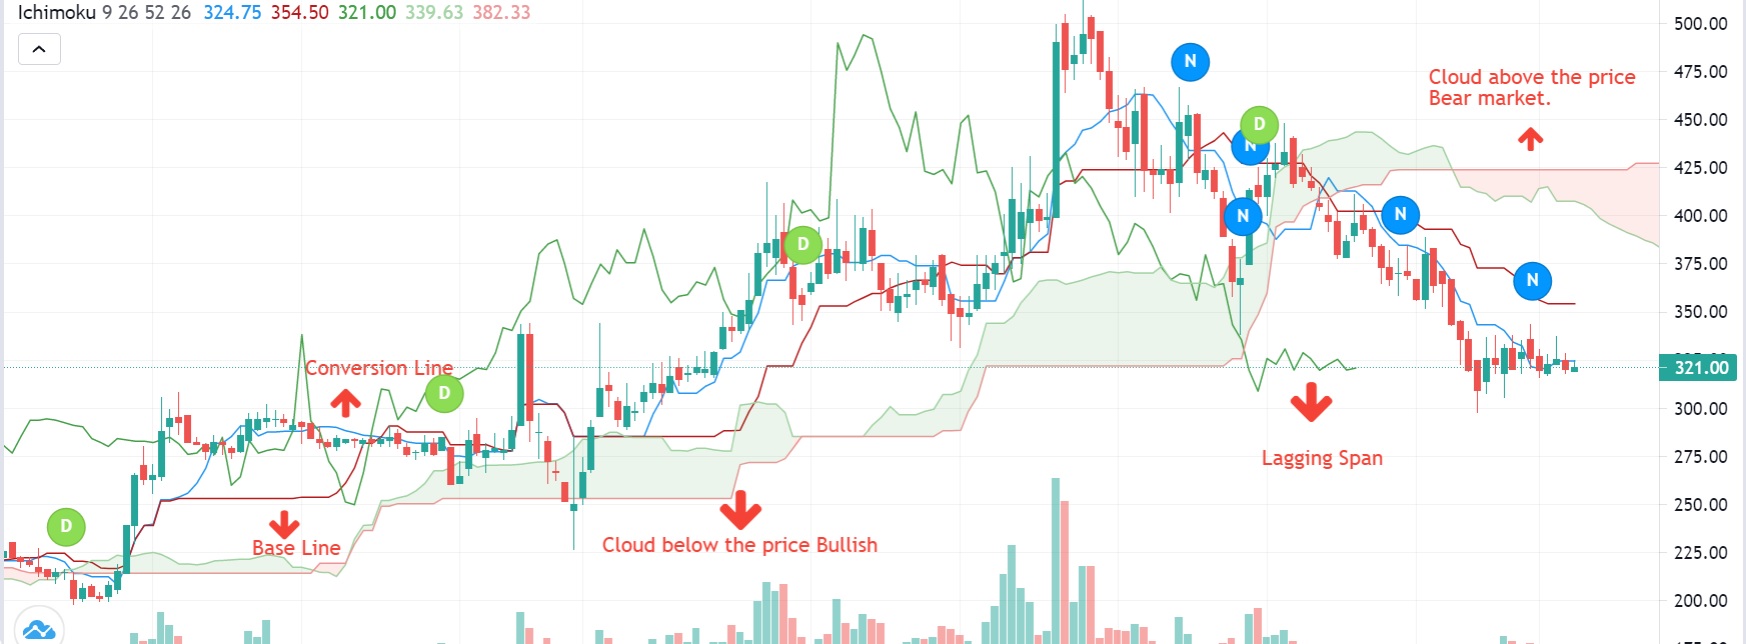
- Conversion line (Tenkan Line)
- Baseline (Kijun Line)
- lagging Span (Chikou Span)
- Future line
- Clouds Leading Span A ( Senkou Span A) and Leading Span B(Senkou Span B)
1. Conversion line:
The conversion line calculates by nine periods on average, and this line moves along with the price. Once the price candle goes above the conversion line, it is the first step to making a buy decision if you do short-period trading, it is a good point to buy.
2. Baseline:
The baseline is a 26-period average. Before the internet was available for all, it was calculated manually, but now ready-made chart indicates hassle-free work online.
Criteria:
a)Candle is above the conversion line
b)Conversion line cut the baseline above
c)Candle is above the baseline
If the above a, b, and c criteria are full fill for the buy, there is more probability that the short-period market can go up. If the pattern changes, the momentum is a downtrend.
3. Lagging Span:
This lagging span moves the same 26 periods back to the current candle. To meet the buying situation, this line must be above the 26th candle; if it is below, still criteria is not valid.
4. Future line:
In the Icimoco cloud trading system, The future line moves 26 periods ahead; based on the past action it predicts the future movement. If there is a green cloud possibility, the market will go up, and if there is a red cloud formation, the market will go down than the current situation.
5. Ichimoco Cloud:
Cloud formation at above the price level indicates the trend is a downtrend; the cloud’s color is RED; if the cloud formation below the price is the bullish condition, the cloud color is GREEN. At this point, if the buy and sell signal is met or is a STRONG buy and sell energy.
Some of other popular indicators are Relative Strength Indicator (RSI), Bollinger Band, Moving Average (MA), Super Trend Indicators help to predict the market.