
Relative Strength Indicator is one of the very popular indicators available in the Technical Analysis, which can use in all time frames for all investment vehicles like a Stock, Option, Currency, Crypto, and more.
Table of Contents
What type of Indicator is RSI?
RSI is a momentum leading indicator based on the recent price movement. Mainly it indicates an overbought and oversold situation of the security. In the RSI Chart, there are numbers 0, 30, 50, 70, 100.
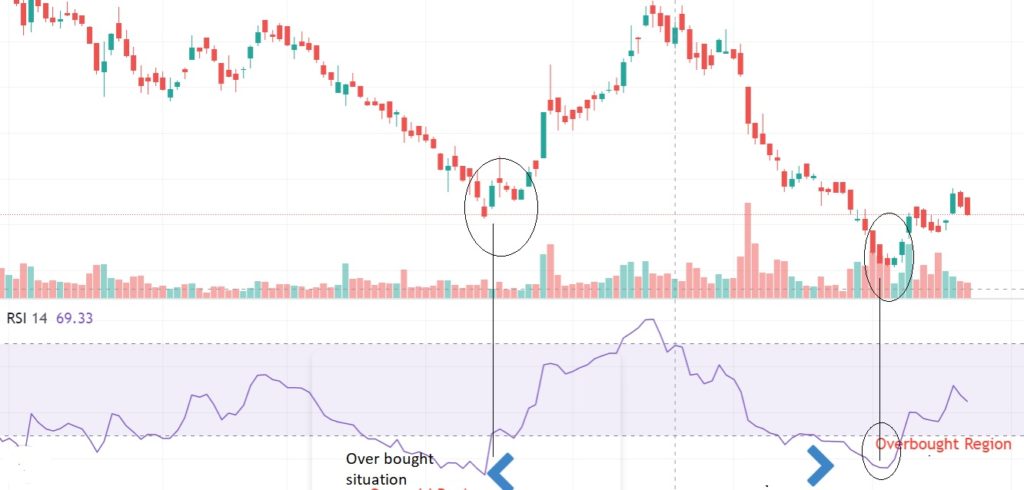
What is overbought?
It is the price investor or traders who believe that the price moves above the actual value. If RSI touches above 70 lines, called an overbought situation. At the overbought area, if the graph gives a clue showing weak RSI strength, at this point, traders can sell the security and reserve the profit.
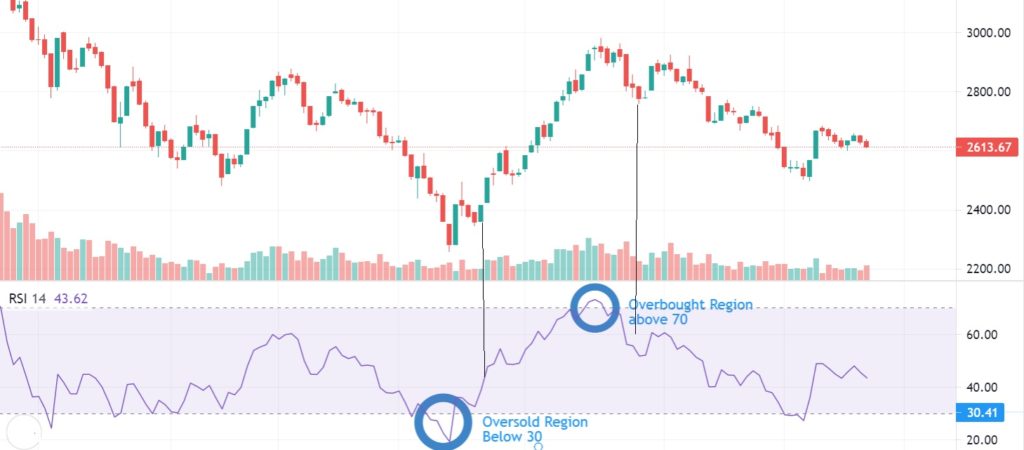
What is oversold?
The price investor or traders believe the price is down the actual value, hence called the oversold situation; In the RSI chart, if the chart line goes below 30 levels called an oversold region. Once it reaches the oversold territory and makes some significant pattern or indicates, the buyer starts to put buy trade.
Can I trade only RSI to get profit?
Indicators are the secondary instrument; it gives some time good signal and sometimes bad or false signal.
I personally, suggest RSI associates with Bollinger Band and moving average. Moving average is the tool most of the fund managers, investors, and traders are using for all kinds of trades. Similarly, Bollinger Band, another authentic indicator used especially while the market is volatile, is when you can catch the right timing and accumulate a large amount of money.
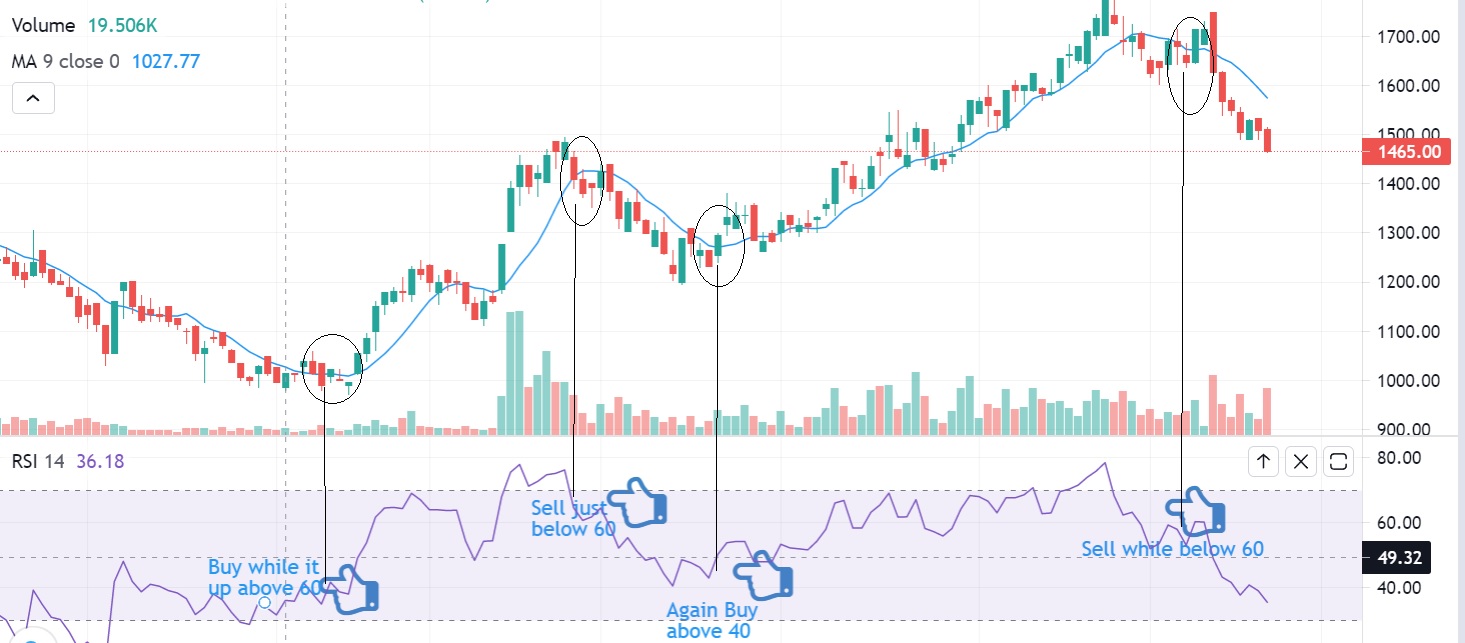
How to Trader with RSI?
I explain RSI trading tips and tricks to get profit using this indicator. While using any of these indicators always takes simple steps, don’t make it complicated.
Take 50 lines as a base point or reference point
If RSI is at the overbought region and coming down below 50 lines, see other indicators; if others also significantly give a sell signal, sell it.
If the market is at oversold region and slightly up and cross the 50 lines and is intended to go up, At the same time, if another indicator also gives a signal to buy, buy it. It is as simple as this.