Technical Indicators are practical terms to use technical analysis to trade any trade, whether stock, option, currency, or investment vehicle.
While trade using technical analysis always uses 2 or 3 indicators to predict the market. Here are some of the popular indicators are:
Table of Contents
Relative Strength Indicator (RSI)
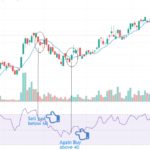
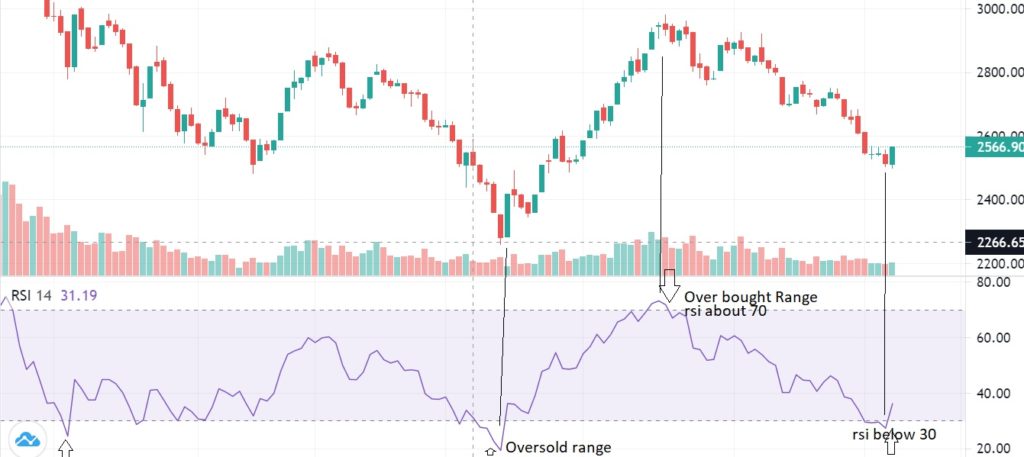
Relative Strength Indicator is a leading indicator that indicates overbought and oversold conditions; when RSI reached above 70 level terms as overbought, and while it went below 30 levels, it terms as oversold. RSI usually goes up while price moves up and down when price fall. Here, RSI divergence that another way to predict the market. If price is at 70 or higher level and price slows higher high to higher low inclined down. Similarly, at the RSI at the same time shows lower-low to Lower-high ( including up) this means RSI sows huge strength that indicates price is chances to go up.
I will make an entire blog for the RSI divergence next time with detailed tips and tricks.
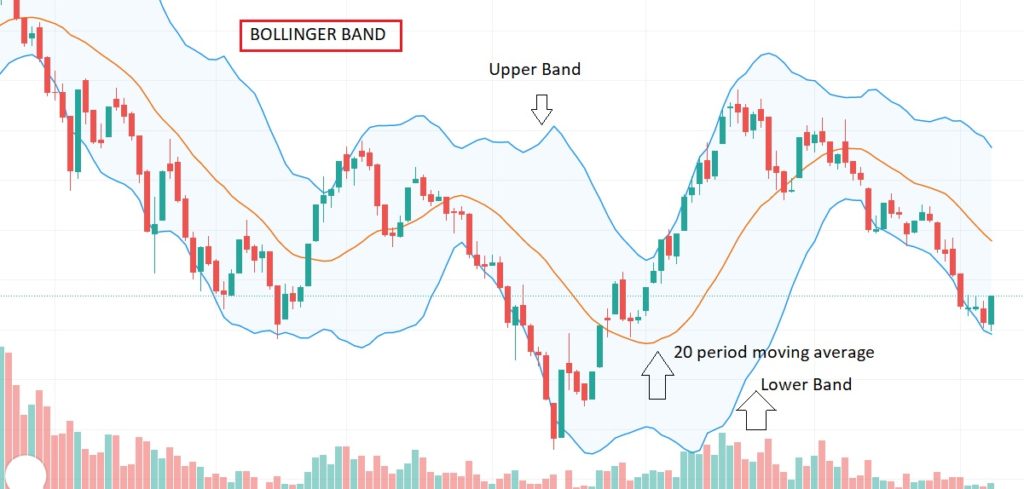
Bollinger Band volatility indicator
John Bollinger invented Bollinger Band; it indicates the volatility of the market. The Bollinger band has two standard deviation bands called the upper and lower bands; the price moves 90%-95% within a band. While the market is volatile, traders have good opportunities using Bollinger bands to profit from the investment. If the price is at the lower Bollinger band and trying to go up with the confirmation candle – is a good opportunity to buy for the short term. Truly can say this indicator is a short term, and using along with other indicator Bollinger Band gives more accuracy result.
Moving Average Convergence and Divergence ( MACD)
MACD is momentum, but a lagging indicator is a relationship between two moving averages. The typical representation of MACD 12 and 26 days EMA and the read Line 9 days EMA
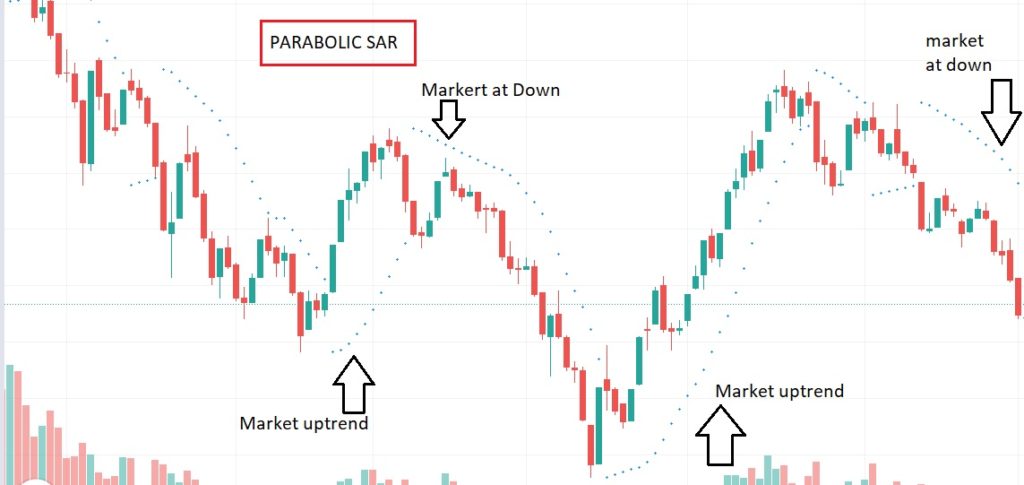
Parabolic SAR
This is another popular indicator that shows the direction of the stock; it is also handy indicator to put stop loss for the short-term analysis. While the price goes up, the dotted line indicates below the graph while the price is below the price line, which shows above while the price is going down. To make more accurate result parabolic SAR combined with other indicator like MA, Bolinger Band, RSI, MACD, etc.
Also, popular terms used are:
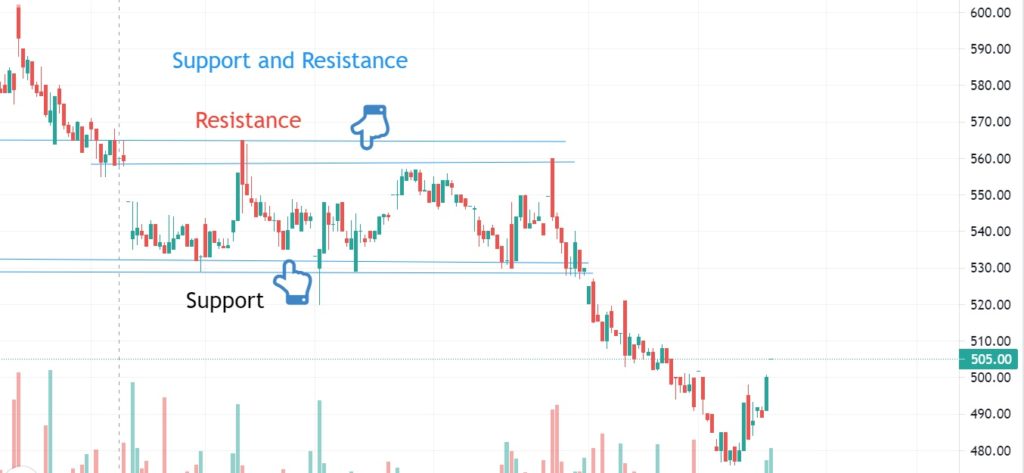
Support and Resistance
Support and Resistance lines, drawn by touching multiple pivot points. Connecting more than 3 lower pivot points called support and connecting more than 3 upper pivot point called Resistance. While price down the current support level than previous support will be the current resistance. Likewise, while price go up and cross the resistance, the previous resistance will be the new support and so on. The Support and Resistance are predefined price levels. When price reaches the resistance level, price tends to stop and reverse its direction similarly while price gets the support level, the price tends to change to another direction.
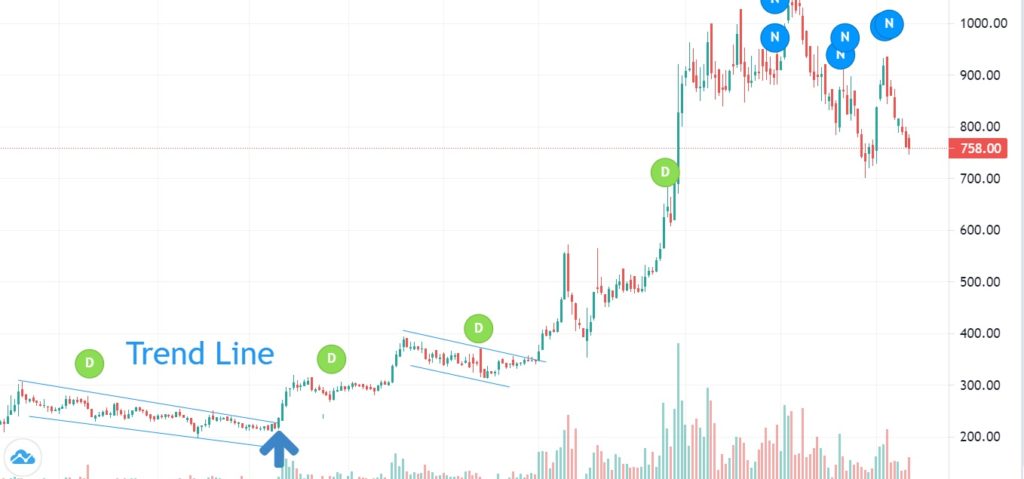
Trendline
The trend line is drawn for the trending market, while the sketch touches high and low points. It also shows the direction of the price and speed, plus gives an excellent indication of where the momentum can reverse. Trendline alone can’t give great results; hence the combination of moving average, candlestick patterns, or support resistance can help more accurate prediction. You should have see lots of charts and draw lots of trendline have a good experience. The more and more you draw and practice better chartist you will have. It is a technique and art.
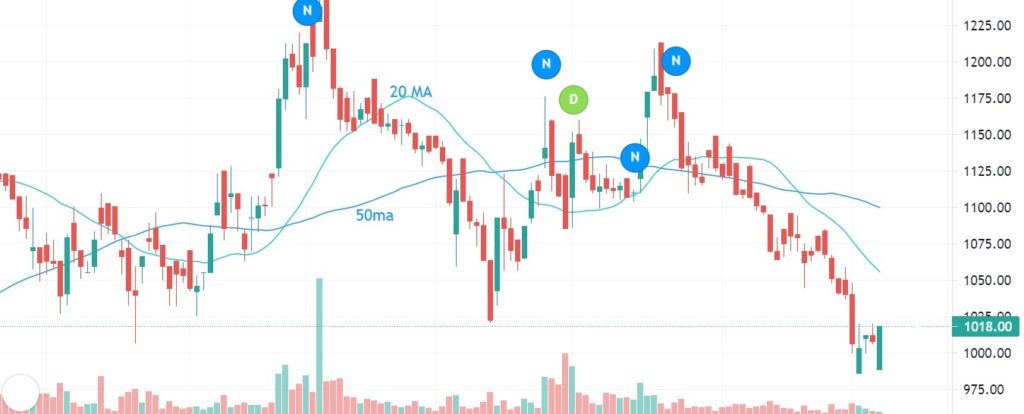
Moving Average
Moving average, widely used for stock technicians for a long time; for the short-term swing trading, 20 days and 50 days moving average is widely popular. Many fund managers and individual traders use this to trade all trading vehicles. If you are using for for long-term investment/ trading you can follow 200 period moving average. Moving average give you the direction of the trend hence, for the buy and sell decision make sure short-term and long-term chart will comply the rule. For example if you do swing Trading and you are follow 50 period moving average; make sure 5 hour chart, daily chat and weekly chart must be uptrend I.e it should be above 50 period moving average.